
import os
import picamera
import sense_hat
import time
import yagmail

camera = picamera.PiCamera()
camera.resolution = (1280, 720)
framerate = 5
camera.framerate = framerate
camera.annotate_text_size = 18

senseHat = sense_hat.SenseHat()

gps = "GPS Data"

def annotate():
    timeNow = "Time: " + str(time.strftime("%a %d %b %Y %H:%M:%S", time.localtime()))
    temperatureNow = "Temperature: " + str(round(senseHat.get_temperature())) + " C"
    humidityNow = "Humidity: " + str(round(senseHat.get_humidity())) + "%"
    locationNow = "Location: " +gps

    annotation = timeNow + "\n" + temperatureNow + "\n" + humidityNow + "\n" + locationNow
    return annotation

def getPicture(annotation):
    filename = "/home/pi/Pictures/" + str(time.strftime("%Y-%m-%d@%H:%M:%S", time.localtime())) + ".jpg"

    try:
        camera.start_preview()
        time.sleep(5)
        camera.annotate_text = annotation
        camera.capture(filename)
        camera.stop_preview()
    except Exception as error:
        print(error)

    return filename

def getVideo(length):
    filename = "/home/pi/Videos/" + str(time.strftime("%Y-%m-%d@%H:%M:%S", time.localtime())) + ".mp4"

    try:
        camera.start_recording("/home/pi/testVideo.h264")

        for index in range(length):
            camera.annotate_text = (annotate())
            time.sleep(1)

        camera.stop_recording()
    except Exception as error:
        print(error)

    os.system("ffmpeg -r " + str(framerate) + " -i /home/pi/testVideo.h264 -vcodec copy " + filename)

    return filename

def sendMail(filename):
    receiver = ["yoimgeorge25@gmail.com", "otheremail@gmail.com"]
    body = "Sent at " + str(time.strftime("%Y-%m-%d %H:%M:%S", time.localtime())) + "."

    try:
        gmail = yagmail.SMTP("email@gmail.com", "password")

        gmail.send(
            to = receiver,
            subject = "Paul's Balloon",
            contents = body,
            attachments = filename
        )
    except Exception as error:
        print(error)

    print("Message sent.")

sendMail(getPicture(annotate()))
Category Archives: Raspberry Pi
.h264 to .mp4 Video with MP4Box
MP4 Video Format
The Pi captures video as a raw H264 video stream. Many media players will refuse to play it, or play it at an incorrect speed, unless it is “wrapped” in a suitable container format like MP4. The easiest way to obtain an MP4 file from the raspivid command is using MP4Box.
Install MP4Box with this command:
sudo apt-get install -y gpacCapture your raw video with raspivid and wrap it in an MP4 container like this:
# Capture 30 seconds of raw video at 640x480 and 150kB/s bit rate into a pivideo.h264 file:
raspivid -t 30000 -w 640 -h 480 -fps 25 -b 1200000 -p 0,0,640,480 -o pivideo.h264
# Wrap the raw video with an MP4 container:
MP4Box -add pivideo.h264 pivideo.mp4
# Remove the source raw file, leaving the remaining pivideo.mp4 file to play
rm pivideo.h264
Alternatively, wrap MP4 around your existing raspivid output, like this:
MP4Box -add video.h264 video.mp4
Scheduling Scripts in CRON
Setting up the Pi to run Python scripts
All right, your Pi is up and running, now you just need to configure it to run Python scripts.
The good news is: there’s not much to do if you are using Raspbian, as it has Python installed out of the box
One thing you can do is download the latest version, probably because Raspbian does not have the latest release. Head over to python.org, and upgrade if necessary.But other than this you are good to go. You can copy your existing .py files and start using them with the built in IDE or Terminal straight away. Speaking of which: if you are copying over files you used on Windows or OS X, remember that on Linux you’ll need a different shebang line. You probably know where to look this up, but here it is for reference:
- On Windows, the shebang line is
#! python3. - On OS X, the shebang line is
#! /usr/bin/env python3. - On Linux, the shebang line is
#! /usr/bin/python3.
(shebang lines are the first lines in python script files that tells the system where to locate the interpreter)
Also, if you want to start scripts from the terminal there are a few extra steps to do:
- Place them .py files in your home folder
- Make them executable with the following command:
chmod +x script.py
Now you can start a script by typing in./script.pyto the terminal
(If you place them somewhere else than your home folder you will have to describe the whole path to start them)
Automating scripts on the Pi with CRON
Now to the interesting part. So far we set up our Pi and started to run python scripts on it. But logging in through RealVNC or SSH every time we want a script to run is not really convenient (with the exception if we want to trigger scripts via SSH coming from another device or service automatically, but this will be detailed in another post).
If we have a web-scraping script that looks for some info on the web every day and returns some information (like the food notifier explained in my previous post), then what we want is total automation. The script should start all by it self, do it’s job, and return the information.
Luckily we can do that with a built in tool in Linux called CRON.
How to setup CRON
- Log into your Pi with realVNC, and start Terminal.
- In the Terminal, enter
crontab -e. If you want a command to run with system permissions, use thesudo crontab -ecommand to open the root account’s crontab file. - You might be asked to select an editor. If this happens choose Nano (for me this was the default)
- You will be presented with the following screen:
Every line that starts with a#is just a comment and will be not executed. - Use the arrows or Page Down to scroll down to the bottom of the page
- Each line you add here will be executed.
The format for the parameters is the following:
Minutes Hours Day of month Month Weekday Command
If you want to skip a parameter, just add * as input.
From the Raspberry Pi Official API:
Scheduling tasks with Cron
Cron is a tool for configuring scheduled tasks on Unix systems. It is used to schedule commands or scripts to run periodically and at fixed intervals. Tasks range from backing up the user’s home folders every day at midnight, to logging CPU information every hour.
The command crontab (cron table) is used to edit the list of scheduled tasks in operation, and is done on a per-user basis; each user (including root) has their own crontab.
Cron GUI
A graphical application for Cron is available by installing the gnome-schedulepackage:
sudo apt-get install gnome-scheduleYou can then launch the program Scheduled Tasks from the main menu.
Editing crontab
Run crontab with the -e flag to edit the cron table:
crontab -eSelect an editor
The first time you run crontab you’ll be prompted to select an editor; if you are not sure which one to use, choose nano by pressing Enter.
Add a scheduled task
The layout for a cron entry is made up of six components: minute, hour, day of month, month of year, day of week, and the command to be executed.
# m h dom mon dow command# * * * * * command to execute
# ┬ ┬ ┬ ┬ ┬
# │ │ │ │ │
# │ │ │ │ │
# │ │ │ │ └───── day of week (0 - 7) (0 to 6 are Sunday to Saturday, or use names; 7 is Sunday, the same as 0)
# │ │ │ └────────── month (1 - 12)
# │ │ └─────────────── day of month (1 - 31)
# │ └──────────────────── hour (0 - 23)
# └───────────────────────── min (0 - 59)For example:
0 0 * * * /home/pi/backup.shThis cron entry would run the backup.sh script every day at midnight.
View scheduled tasks
View your currently saved scheduled tasks with:
crontab -lRun a task on reboot
To run a command every time the Raspberry Pi starts up, write @reboot instead of the time and date. For example:
@reboot python /home/pi/myscript.pyThis will run your Python script every time the Raspberry Pi reboots. If you want your command to be run in the background while the Raspberry Pi continues starting up, add a space and & at the end of the line, like this:
@reboot python /home/pi/myscript.py &KML Guide
KML Tutorial
| KML is a file format used to display geographic data in an Earth browser such as Google Earth. KML uses a tag-based structure with nested elements and attributes and is based on the XML standard. All tags are case-sensitive and must appear exactly as they are listed in the KML Reference. The Reference indicates which tags are optional. Within a given element, tags must appear in the order shown in the Reference.
If you’re new to KML, explore this document and the accompanying samples files (SamplesInEarth) to begin learning about the basic structure of a KML file and the most commonly used tags. The first section describes features that can be created with the Google Earth user interface. These features include placemarks, descriptions, ground overlays, paths, and polygons. The second section describes features that require authoring KML with a text editor. When a text file is saved with a .kml or .kmz extension, Earth browsers know how to display it. |
 |
Tip: To see the KML “code” for a feature in Google Earth, you can simply right-click the feature in the 3D Viewer of Google Earth and select Copy. Then Paste the contents of the clipboard into any text editor. The visual feature displayed in Google Earth is converted into its KML text equivalent. Be sure to experiment with this feature.
All of the examples described here are in the KML Samples file. Begin by downloading that file to view the examples in Google Earth.
For More Information
The KML 2.2 Reference provides details about the KML file format. If you’re familiar with XML, you will also be interested in the KML 2.2 Schema.
For a discussion of how to use some of the key features in KML, see the Developer’s Guide.
Table of Contents
Basic KML Documents
The simplest kind of KML documents are those that can be authored directly in Google Earth—that is, you don’t need to edit or create any KML in a text editor. Placemarks, ground overlays, paths, and polygons can all be authored directly in Google Earth.
Placemarks
A Placemark is one of the most commonly used features in Google Earth. It marks a position on the Earth’s surface, using a yellow pushpin as the icon. The simplest Placemark includes only a <Point> element, which specifies the location of the Placemark. You can specify a name and a custom icon for the Placemark, and you can also add other geometry elements to it.
Open the KML Samples file in Google Earth and expand the Placemarks subfolder. This folder includes three different types of placemark: simple, floating, and extruded. The KML code for the simple placemark looks like this:
<?xml version="1.0" encoding="UTF-8"?>
<kml xmlns="http://www.opengis.net/kml/2.2">
  <Placemark>
    <name>Simple placemark</name>
    <description>Attached to the ground. Intelligently places itself
       at the height of the underlying terrain.</description>
    <Point>
      <coordinates>-122.0822035425683,37.42228990140251,0</coordinates>
    </Point>
  </Placemark>
</kml>
The structure of this file breaks down as follows:
- An XML header. This is line 1 in every KML file. No spaces or other characters can appear before this line.
- A KML namespace declaration. This is line 2 in every KML 2.2 file.
- A Placemark object that contains the following elements:
- A name that is used as the label for the Placemark
- A description that appears in the “balloon” attached to the Placemark
- A Point that specifies the position of the Placemark on the Earth’s surface (longitude, latitude, and optional altitude)
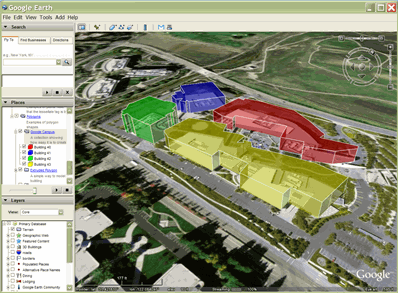
If you were wondering where the Placemark is, it’s right over Google’s Building 41, where we developed Google Earth!
What users commonly think of as a “placemark” in Google Earth is actually a <Placemark> element with a <Point> child in KML. A Point Placemark is the only way to draw an icon and label in the 3D Viewer of Google Earth. By default, the icon is the familiar yellow pushpin. In KML, a <Placemark> can contain one or more geometry elements, such as a LineString, Polygon, or Model. But only a <Placemark> with a Point can have an icon and label. The Point is used to place the icon, but there is no graphical representation of the Point itself.
Descriptive HTML in Placemarks
The KML Samples file has an example of almost everything you can do with Placemark text. You can add links, font sizes, styles, and colors, and specify text alignment and tables. If you’d like to see the full list, copy and paste the “Descriptive HTML” Placemark example (in the Styles and Markup folder) into a text editor.
Auto-Markup in Google Earth (Release 4.0 and later)
Google Earth 4.0 has an auto-markup feature that automatically converts text such as www.google.com into active hyperlinks that the user can click. Text inside the <description> tag, the <Snippet> tag, and the <text> element of <BalloonStyle> are all automatically transformed into standard HTTP hyperlinks. You don’t need to add the <a href= …> tags yourself.
Using the CDATA Element
If you want to write standard HTML inside a <description> tag, you can put it inside a CDATA tag. If you don’t, the angle brackets need to be written as entity references to prevent Google Earth from parsing the HTML incorrectly (for example, the symbol > is written as > and the symbol < is written as <). This is a standard feature of XML and is not unique to Google Earth.
Consider the difference between HTML markup with CDATA tags and without CDATA. First, here’s the <description> with CDATA tags:
<?xml version="1.0" encoding="UTF-8"?>
<kml xmlns="http://www.opengis.net/kml/2.2">
  <Document>
    <Placemark>
      <name>CDATA example</name>
      <description>
        <![CDATA[
          <h1>CDATA Tags are useful!</h1>
          <p><font color="red">Text is <i>more readable</i> and
          <b>easier to write</b> when you can avoid using entity
          references.</font></p>
        ]]>
      </description>
      <Point>
        <coordinates>102.595626,14.996729</coordinates>
      </Point>
    </Placemark>
  </Document>
</kml>
And here’s the <description> without CDATA tags, so that special characters must use entity references:
<?xml version="1.0" encoding="UTF-8"?>
<kml xmlns="http://www.opengis.net/kml/2.2">
<Document>
<Placemark>
<name>Entity references example</name>
<description>
<h1>Entity references are hard to type!</h1>
<p><font color="green">Text is
<i>more readable</i>
and <b>easier to write</b>
when you can avoid using entity references.</font></p>
</description>
<Point>
<coordinates>102.594411,14.998518</coordinates>
</Point>
</Placemark>
</Document>
</kml>
Ground Overlays
Ground overlays enable you to “drape” an image onto the Earth’s terrain. The <Icon> element contains the link to the .jpgfile with the overlay image. Here is the example ground overlay in the KML Samples file, which shows Mount Etna erupting in 2001:
<?xml version="1.0" encoding="UTF-8"?>
<kml xmlns="http://www.opengis.net/kml/2.2">
  <Folder>
    <name>Ground Overlays</name>
    <description>Examples of ground overlays</description>
    <GroundOverlay>
      <name>Large-scale overlay on terrain</name>
      <description>Overlay shows Mount Etna erupting
          on July 13th, 2001.</description>
      <Icon>
        <href>https://developers.google.com/kml/documentation/images/etna.jpg</href>
      </Icon>
      <LatLonBox>
        <north>37.91904192681665</north>
        <south>37.46543388598137</south>
        <east>15.35832653742206</east>
        <west>14.60128369746704</west>
        <rotation>-0.1556640799496235</rotation>
      </LatLonBox>
    </GroundOverlay>
  </Folder>
</kml>
Notice that the file begins with the same two lines as the first example: the XML header and KML namespace declaration.
This example uses a Folder (titled “Ground Overlays”) as a mechanism to group and label its contents. Notice how the Folder appears in the Places panel when you load the KML Samples file into Google Earth.
The positioning of a ground overlay is controlled by the <LatLonBox> tag. Bounding values are given for the north and south latitudes, and east and west longitudes. In addition, rotation values are given for images whose y-axis doesn’t coincide with grid north. This example uses a JPEG image for the overlay. Google Earth also supports BMP, GIF, TIFF, TGA, and PNG formats.
Paths
Many different types of paths can be created in Google Earth, and it is easy to be very creative with your data. In KML, a path is created by a <LineString> element. Take a look at the “Absolute Extruded” example in the Paths folder and you can see how the shape has been generated by the following code:
<?xml version="1.0" encoding="UTF-8"?>
<kml xmlns="http://www.opengis.net/kml/2.2">
  <Document>
    <name>Paths</name>
    <description>Examples of paths. Note that the tessellate tag is by default
      set to 0. If you want to create tessellated lines, they must be authored
      (or edited) directly in KML.</description>
    <Style id="yellowLineGreenPoly">
      <LineStyle>
        <color>7f00ffff</color>
        <width>4</width>
      </LineStyle>
      <PolyStyle>
        <color>7f00ff00</color>
      </PolyStyle>
    </Style>
    <Placemark>
      <name>Absolute Extruded</name>
      <description>Transparent green wall with yellow outlines</description>
      <styleUrl>#yellowLineGreenPoly</styleUrl>
      <LineString>
        <extrude>1</extrude>
        <tessellate>1</tessellate>
        <altitudeMode>absolute</altitudeMode>
        <coordinates> -112.2550785337791,36.07954952145647,2357
          -112.2549277039738,36.08117083492122,2357
          -112.2552505069063,36.08260761307279,2357
          -112.2564540158376,36.08395660588506,2357
          -112.2580238976449,36.08511401044813,2357
          -112.2595218489022,36.08584355239394,2357
          -112.2608216347552,36.08612634548589,2357
          -112.262073428656,36.08626019085147,2357
          -112.2633204928495,36.08621519860091,2357
          -112.2644963846444,36.08627897945274,2357
          -112.2656969554589,36.08649599090644,2357
        </coordinates>
      </LineString>
    </Placemark>
  </Document>
</kml>
Notice how it is really just one line drawn at altitude above the ground. The <tessellate> tag breaks the line up into smaller chunks, and the <extrude> tag extends the line down to the ground.
Polygons
You can use Polygons to create simple buildings and other shapes. Check out the Polygons folder in the KML Samplesfile for examples.
The Pentagon example is generated by drawing simple inner and outer shells and then extruding them down to the ground. Here is the code :
<?xml version="1.0" encoding="UTF-8"?>
<kml xmlns="http://www.opengis.net/kml/2.2">
  <Placemark>
    <name>The Pentagon</name>
    <Polygon>
      <extrude>1</extrude>
      <altitudeMode>relativeToGround</altitudeMode>
      <outerBoundaryIs>
        <LinearRing>
          <coordinates>
            -77.05788457660967,38.87253259892824,100
            -77.05465973756702,38.87291016281703,100
            -77.05315536854791,38.87053267794386,100
            -77.05552622493516,38.868757801256,100
            -77.05844056290393,38.86996206506943,100
            -77.05788457660967,38.87253259892824,100
          </coordinates>
        </LinearRing>
      </outerBoundaryIs>
      <innerBoundaryIs>
        <LinearRing>
          <coordinates>
            -77.05668055019126,38.87154239798456,100
            -77.05542625960818,38.87167890344077,100
            -77.05485125901024,38.87076535397792,100
            -77.05577677433152,38.87008686581446,100
            -77.05691162017543,38.87054446963351,100
            -77.05668055019126,38.87154239798456,100
          </coordinates>
        </LinearRing>
      </innerBoundaryIs>
    </Polygon>
  </Placemark>
</kml>
2 Advanced KML Documents
This section describes some of the KML elements that must be authored using a text editor, such as shared styles for geometry, highlighted icons for Placemarks, and screen overlays. Authoring KML “by hand” is a bit more advanced than using the Google Earth interface to create and modify features, but with a small amount of practice, most users are comfortable editing KML files to add these effects.
Styles for Geometry
Once you’ve created features within Google Earth and examined the KML code Google Earth generates, you’ll notice how styles are an important part of how your data is displayed. Power users will want to learn how to define their own styles.
If you define a Style at the beginning of a KML Document and also define an ID for it, you can use this style in Geometry, Placemarks, and Overlays that are defined elsewhere in the Document. Because more than one element can use the same Style, styles defined and used in this way are referred to as shared styles. You define a given Style once, and then you can reference it multiple times, using the <styleUrl> element. If the Style definition is within the same file, precede the Style ID with a # sign. If the Style definition is in an external file, include the complete URL in the <styleUrl> element.
The KML Samples file contains a number of shared styles, each defined with an ID at the beginning of the file. Note that it’s easiest if your IDs are descriptive strings so that you can easily tell what their effect is. Here’s an example of a style (“transBluePoly”) that defines a transparent blue color for the polygon faces and a line width of 1.5 (and default color of white) for the edges of the polygon. This style is used by Building 41 in the Google Campus example (in the Polygons folder):
<?xml version="1.0" encoding="UTF-8"?>
<kml xmlns="http://www.opengis.net/kml/2.2">
  <Document>
    <Style id="transBluePoly">
      <LineStyle>
        <width>1.5</width>
      </LineStyle>
      <PolyStyle>
        <color>7dff0000</color>
      </PolyStyle>
    </Style>
    <Placemark>
      <name>Building 41</name>
      <styleUrl>#transBluePoly</styleUrl>
      <Polygon>
        <extrude>1</extrude>
        <altitudeMode>relativeToGround</altitudeMode>
        <outerBoundaryIs>
          <LinearRing>
            <coordinates> -122.0857412771483,37.42227033155257,17
              -122.0858169768481,37.42231408832346,17
              -122.085852582875,37.42230337469744,17
              -122.0858799945639,37.42225686138789,17
              -122.0858860101409,37.4222311076138,17
              -122.0858069157288,37.42220250173855,17
              -122.0858379542653,37.42214027058678,17
              -122.0856732640519,37.42208690214408,17
              -122.0856022926407,37.42214885429042,17
              -122.0855902778436,37.422128290487,17
              -122.0855841672237,37.42208171967246,17
              -122.0854852065741,37.42210455874995,17
              -122.0855067264352,37.42214267949824,17
              -122.0854430712915,37.42212783846172,17
              -122.0850990714904,37.42251282407603,17
              -122.0856769818632,37.42281815323651,17
              -122.0860162273783,37.42244918858722,17
              -122.0857260327004,37.42229239604253,17
              -122.0857412771483,37.42227033155257,17
            </coordinates>
          </LinearRing>
        </outerBoundaryIs>
      </Polygon>
    </Placemark>
  </Document>
</kml>
Note that the <styleUrl> element is a child of <Placemark> (not of the Geometry it affects).
Styles for Highlighted Icons
The “Highlighted Icon ” in the Styles and Markup folder shows you how to create a roll-over effect with KML. The Document defines two styles, one for the “normalPlacemark” and one for the “highlightPlacemark” (shown when the cursor rolls over the Icon). The <StyleMap> element has two key/value pairs that map each icon style to an icon state. There are two icon states: normal and highlight.
The basic steps shown here are as follows:
- Define a <Style> for the Placemark’s normal icon, and assign an ID to it (here, “normal Placemark”). The <Style> includes an <Icon> with an <href> to the actual image to use, as shown below.
- Define a <Style> for the Placemark’s highlight icon and assign an ID to it (here, “highlightPlacemark”).
- Create the <StyleMap> element and assign an ID to it (“exampleStyleMap”). The Placemark will refer to this ID.
- In the <StyleMap> element, specify “#normalPlacemark” for the normal state.
- In the <StyleMap> element, specify “#highlightPlacemark” for the highlight state.
- In the Placemark, add a <styleUrl> element that refers to “#exampleStyleMap.”
<?xml version="1.0" encoding="UTF-8"?>
<kml xmlns="http://www.opengis.net/kml/2.2">
  <Document>
    <name>Highlighted Icon</name>
    <description>Place your mouse over the icon to see it display the new icon</description>
    <Style id="highlightPlacemark">
      <IconStyle>
        <Icon>
          <href>http://maps.google.com/mapfiles/kml/paddle/red-stars.png</href>
        </Icon>
      </IconStyle>
    </Style>
    <Style id="normalPlacemark">
      <IconStyle>
        <Icon>
          <href>http://maps.google.com/mapfiles/kml/paddle/wht-blank.png</href>
        </Icon>
      </IconStyle>
    </Style>
    <StyleMap id="exampleStyleMap">
      <Pair>
        <key>normal</key>
        <styleUrl>#normalPlacemark</styleUrl>
      </Pair>
      <Pair>
        <key>highlight</key>
        <styleUrl>#highlightPlacemark</styleUrl>
      </Pair>
    </StyleMap>
    <Placemark>
      <name>Roll over this icon</name>
      <styleUrl>#exampleStyleMap</styleUrl>
      <Point>
        <coordinates>-122.0856545755255,37.42243077405461,0</coordinates>
      </Point>
    </Placemark>
  </Document>
</kml>
Screen Overlays
Screen overlays cannot be authored directly within Google Earth and are thus more difficult to create than ground overlays. A comprehensive collection of samples is included in the Screen Overlays folder in the KML Samples file.
As an example, enable the “Absolute Positioning: Top left” folder in the KML Samples file and you will see a screen overlay at the top left of the view window. This was created with the following KML code:
<?xml version="1.0" encoding="UTF-8"?>
<kml xmlns="http://www.opengis.net/kml/2.2">
  <ScreenOverlay>
    <name>Absolute Positioning: Top left</name>
    <Icon>
      <href>http://developers.google.com/kml/documentation/images/top_left.jpg</href>
    </Icon>
    <overlayXY x="0" y="1" xunits="fraction" yunits="fraction"/>
    <screenXY x="0" y="1" xunits="fraction" yunits="fraction"/>
    <rotationXY x="0" y="0" xunits="fraction" yunits="fraction"/>
    <size x="0" y="0" xunits="fraction" yunits="fraction"/>
  </ScreenOverlay>
</kml>
Positioning is controlled by mapping a point in the image specified by <overlayXY> to a point on the screen specified by <screenXY>. In this case, the top-left corner of the image (0,1) has been made coincident with the same point on the screen.
Check the other examples in the folder to see how it is possible to obtain other fixed positions, and to create images that size dynamically with screen size. (Note that xunits and yunits can also be specified as “pixels” for precision control.) For further detail, see the KML 2.2 Reference.
Network Links
A network link contains a <Link> element with an <href> (a hypertext reference) that loads a file. The <href> can be a local file specification or an absolute URL. Despite the name, a <NetworkLink> does not necessarily load files from the network.
The <href> in a link specifies the location of any of the following:
- An image file used by icons in icon styles, ground overlays, and screen overlays
- A model file used in the <Model> element
- A KML or KMZ file loaded by a Network Link
The specified file can be either a local file or a file on a remote server. In their simplest form, network links are a useful way to split one large KML file into smaller, more manageable files on the same computer.
So far, all of our examples have required that the KML code be delivered to Google Earth from the local machine. Network links give you the power to serve content from a remote location and are commonly used to distribute data to large numbers of users. In this way, if the data needs to be amended, it has to be changed only at the source location, and all users receive the updated data automatically.
CGI Scripting for KML
In addition to pointing to files containing static data, a network link’s <href> can point to data that is dynamically generated—for example, by a CGI script located on a network server. With some knowledge of a scripting language such as PHP, Python, or Perl, you can create a script that delivers a stream (or file) of KML data to each network link.
Two things are necessary for delivering KML through a network CGI:
When a call is made from the client (Google Earth) to the server, the server must (1) return a response code of HTTP 200 and (2) set the response’s content type to text/plain or application/vnd.google-earth.kml+xml.
The response must be valid KML. For complex applications, proper error handling is very important.
Tip: A simple way to handle errors is to parse the server’s error as the text for a folder name. For example, you could have the server return <Folder><name>database inaccessible</name></Folder> as a string. This is more informative (and more user-friendly) than letting the connection drop.
The following examples use Python, but they are equally valid in any other scripting language.
Generating a Random Placemark
The following Python script generates random integer values for latitude and longitude and then inserts those values into the <coordinates> element of a <Point>. Whenever the network link is refreshed, the Python script runs again and generates KML with new latitude and longitude values.
#!/usr/bin/python

import random

latitude = random.randrange(-90, 90)
longitude = random.randrange(-180, 180)
kml = (
   '<?xml version="1.0" encoding="UTF-8"?>\n'
   '<kml xmlns="http://www.opengis.net/kml/2.2">\n'
   '<Placemark>\n'
   '<name>Random Placemark</name>\n'
   '<Point>\n'
   '<coordinates>%d,%d</coordinates>\n'
   '</Point>\n'
   '</Placemark>\n'
   '</kml>'
   ) %(longitude, latitude)
print 'Content-Type: application/vnd.google-earth.kml+xml\n'
print kml
Here is an example of a KML file containing a Network Link that loads this Python script:
<?xml version="1.0" encoding="UTF-8"?>
<kml xmlns="http://www.opengis.net/kml/2.2">
  <Folder>
    <name>Network Links</name>
    <visibility>0</visibility>
    <open>0</open>
    <description>Network link example 1</description>
    <NetworkLink>
      <name>Random Placemark</name>
      <visibility>0</visibility>
      <open>0</open>
      <description>A simple server-side script that generates a new random
        placemark on each call</description>
      <refreshVisibility>0</refreshVisibility>
      <flyToView>0</flyToView>
      <Link>
        <href>http://yourserver.com/cgi-bin/randomPlacemark.py</href>
      </Link>
    </NetworkLink>
  </Folder>
</kml>
View-Based Refresh Queries
A standard network link is a uni-directional link: data flows only from the server to Google Earth. The view-based refresh enables bi-directional communication. When the view-based refresh is active, Google Earth returns the view coordinates to the server at a specified time. This may be every n seconds, minutes, or hours, or once a certain amount of time has elapsed since the view stopped moving. See <viewRefreshMode> in the KML 2.2 Reference.
The coordinates are returned to the server by means of an HTTP GET that appends the coordinates as follows (this is the default bounding box information):
GET /path/to/sever/script/query?BBOX=[longitude_west, latitude_south, longitude_east, latitude_north] HTTP/1.1
If the request were made while the user was looking down on San Francisco, the coordinates might look as follows:
GET /path/to/server/script/query?BBOX=-122.497790,37.730385,-122.380087,37.812331 HTTP/1.1
This feature can be used for some very creative applications, but to get you started, a simple example is presented below.
Tracking a Point Directly Under Your View
The following server-side Python script parses the return message sent by Google Earth and responds with a Placemark at the center of the screen. Each time the Network Link is refreshed, a new Placemark is generated.
#!/usr/bin/python

import cgi

url = cgi.FieldStorage()
bbox = url['BBOX'].value
bbox = bbox.split(',')
west = float(bbox[0])
south = float(bbox[1])
east = float(bbox[2])
north = float(bbox[3])

center_lng = ((east - west) / 2) + west
center_lat = ((north - south) / 2) + south

kml = (
   '<?xml version="1.0" encoding="UTF-8"?>\n'
   '<kml xmlns="http://www.opengis.net/kml/2.2">\n'
   '<Placemark>\n'
   '<name>View-centered placemark</name>\n'
   '<Point>\n'
   '<coordinates>%.6f,%.6f</coordinates>\n'
   '</Point>\n'
   '</Placemark>\n'
   '</kml>'
   ) %(center_lng, center_lat)

print 'Content-Type: application/vnd.google-earth.kml+xml\n'
print kml
And here is the KML for the Network Link that loads the Python script:
<?xml version="1.0" encoding="UTF-8"?>
<kml xmlns="http://www.opengis.net/kml/2.2">
  <Folder>
    <name>Network Links</name>
    <visibility>0</visibility>
    <open>0</open>
    <description>Network link example 2</description>
    <NetworkLink>
      <name>View Centered Placemark</name>
      <visibility>0</visibility>
      <open>0</open>
      <description>The view-based refresh allows the remote server to calculate
         the center of your screen and return a placemark.</description>
      <refreshVisibility>0</refreshVisibility>
      <flyToView>0</flyToView>
      <Link>
        <href>http://yourserver.com/cgi-bin/viewCenteredPlacemark.py</href>
        <refreshInterval>2</refreshInterval>
        <viewRefreshMode>onStop</viewRefreshMode>
        <viewRefreshTime>1</viewRefreshTime>
      </Link>
    </NetworkLink>
  </Folder>
</kml>
The principle illustrated in this example can be used for some very complex applications. For example, if you have a database of geographic information, you can extract the coordinates of the viewer, make a call to the database for the data specific to the view, and return it to Google Earth as KML.
3 KML MIME Types
When responding to a request from Google Earth (or any Earth browser), a KML server must follow a certain set of rules so that Google Earth can correctly interpret its responses.
Upon success, the server must return a response code of HTTP 200 and set the response’s content-type to a suitable MIME type, as described here.
Google Earth reads KML and KMZ files. The MIME type for KML files is
application/vnd.google-earth.kml+xml
The MIME type for KMZ files is
application/vnd.google-earth.kmz
For Apache, add these lines to the httpd.conf file:
AddType application/vnd.google-earth.kml+xml .kmlAddType application/vnd.google-earth.kmz .kmz
See the Microsoft documentation for details on setting up MIME types on Microsoft’s IIS.
The body of the response must contain valid KML data, including the XML declaration (<?xml version="1.0" encoding="UTF-8"?>). If the server returns invalid KML, the Network Link will stop, deactivate, and output an error message.
What’s Next?
Ready for more? Check out the Developer’s Guide, which describes key KML features. Also, browse the KML Reference for information on specific elements.
NMEA Sentence Parsing Guide
Python GPS NMEA Statement Parsing Code in Need of Serious Debugging
import serial

port = "/dev/ttyS0"

def parseGPS(data):
#    print "raw:", data #prints raw data
    if data[0:6] == "$GPRMC":
        sdata = data.split(",")
        if sdata[2] == 'V':
            print("no satellite data available")
            return
        print( "---Parsing GPRMC---",
        time = sdata[1][0:2] + ":" + sdata[1][2:4] + ":" + sdata[1][4:6]
        lat = decode(sdata[3]) #latitude
        dirLat = sdata[4]      #latitude direction N/S
        lon = decode(sdata[5]) #longitute
        dirLon = sdata[6]      #longitude direction E/W
        speed = sdata[7]       #Speed in knots
        trCourse = sdata[8]    #True course
        date = sdata[9][0:2] + "/" + sdata[9][2:4] + "/" + sdata[9][4:6]#date

        print "time : %s, latitude : %s(%s), longitude : %s(%s), speed : %s, True Course : %s, Date : %s" %  (time,lat,dirLat,lon,dirLon,speed,trCourse,date)

def decode(coord):
    #Converts DDDMM.MMMMM > DD deg MM.MMMMM min
    x = coord.split(".")
    head = x[0]
    tail = x[1]
    deg = head[0:-2]
    min = head[-2:]
    return deg + " deg " + min + "." + tail + " min"


print "Receiving GPS data"
ser = serial.Serial(port, baudrate = 9600, timeout = 0.5)
while True:
   data = ser.readline()
   parseGPS(data)
Raspberry Pi Touchscreen Installation
| How to Install the Matchbox-Keyboard for your Pi
1. Connect a physical keyboard to the Raspberry Pi (or SSH into it if that’s your thing.) 2. Connect to the internet via WiFi or Ethernet. 3. Open the terminal. 4. Type sudo apt-get install matchbox-keyboard 5. Let the program download & install (takes 30s-1min depending on your connection.) 6. Exit the terminal & reboot your Pi. 7. The keyboard can be found by clicking the Menu -> Accessories -> Keyboard. |

| Operating System Support
In order to be sure you’re running the latest version of Raspbian, connect your Raspberry Pi to the Internet and then open LX Terminal. Type ‘sudo apt-get update’ to download the latest version of the OS. Once that’s complete, type ‘sudo apt-get upgrade’ to apply the download to your Raspberry Pi. That way you’ll have all of the latest drivers and software needed to support the touch screen display. |
|
| Step 1
|
|
 Step 2
 Step 3
 Step 4
 Step 5
 Step 6
 Step 7
 Step 8
 Step 9
Pi to Pi LoRa
-

Login the RPI.
-

Copy this url.
-

-

-

Use this command to complete.
-

-


GPS with the Dragino LoRa Hat
Getting GPS to work on a Raspberry Pi 3 Model B
“My GPIO-connected UART device is broken on Pi 3, why?
The mini-uart is now routed to GPIO14/15 as the PL011 UART is now used for bluetooth communications. The mini-uart doesn’t have a separate clock divisor and uses the core clock frequency. Changes in core clock (e.g. through throttling or idle/load frequency changes) will result in arbitrary modification of the effective baud rate. There’s no easy way around this, but as a workaround there is a pi3-disable-bt devicetree overlay in latest rpi-update firmware which reverts this change.”
We will show you the operations in the next steps.
Connection

Connect the LoRa/GPS HAT to Rpi, use built-in patch GPS antenna.
Enable the UART
First we need to download and install a new device tree overlay.
The Raspberry Pi Engineer PhillE (forum username) has kindly made a custom overlay called pi3-miniuart-bt-overlay.dtb to remap the UART ports and this needs to be copied into the /boot/overlays folder on the SD card and we also copied it into the root / pi3-miniuart-bt-overlay.dtb of the card as well.
We have made a copy of the new boot overlay available to download from here and it will also be included in a future Raspbian Linux release. We have archived the overlay in zip format and it will need to be uncompressed and copied to your SD card.
Next we need to edit the /boot/config.txt file, open the file either on your desktop computer or using the Raspberry Pi via SSH
sudo nano /boot/config.txt
You need to add the following lines:
dtparam=spi=on
dtoverlay=pi3-disable-bt-overlay
core_freq=250
enable_uart=1
force_turbo=1
Then use Ctrl+O to save changes and use Ctrl+X to exit.

edit /boot/config.txt
Now edit /boot/cmdline.txt.
sudo nano /boot/cmdline.txt
Change the file to the following:
dwc_otg.lpm_enable=0 console=tty1 root=/dev/mmcblk0p2 rootfstype=ext4 elevator=deadline fsck.repair=yes rootwait
Exit and save your changes
If you have edited the cmdline.txt and config.txt files on your desktop put the SD card back in your Raspberry Pi 3 and boot to either a network SSH session or desktop and run the following in a shell window.
If you want to disable the built in bluetooth you need to stop hciattach trying to use the modem via uart0 which will disable the relevant systemd service
sudo systemctl disable hciuart
Now edit /lib/systemd/system/hciuart.server and replace ttyAMA0 with ttyS0 .
sudo nano /lib/systemd/system/hciuart.service
Replace “After=dev-serial1.device” with “After=dev-ttyS0.device”
Exit and save your changes

edit /lib/systemd/system/hciuart.server
You need to update the operating system with the latest patches with:
sudo apt-get update
sudo apt-get upgrade
sudo reboot
Once your Raspberry Pi 3 has rebooted you should now have access to the serial console via the GPIO header at 9600 baud.
If you just want to do a quick check to see what data is coming out of the GPS, you can enter the following command, following by CTRL+C to quit:
sudo cat /dev/ttyS0

cat /dev/ttyS0
Run the following two commands to stop and disable the tty service:
 sudo systemctl stop serial-getty@ttyS0.service
 sudo systemctl disable serial-getty@ttyS0.service
Reboot
sudo shutdown -r now
Install GPSD
You can always just read that raw data, but its much nicer if you can have some Linux software prettify it. We’ll try out gpsd which is a GPS-handling Daemon (background-helper)
To install gpsd, make sure your Pi has an Internet connection and run the following commands from the console:
sudo apt-get install gpsd gpsd-clients python-gps
Raspbian Jessie systemd service fix
Note if you’re using the Raspbian Jessie or later release you’ll need to disable a systemd service that gpsd installs. This service has systemd listen on a local socket and run gpsd when clients connect to it, however it will also interfere with other gpsd instances that are manually run (like in this guide). You will need to disable the gpsd systemd service by running the following commands:
 sudo systemctl stop gpsd.socket
 sudo systemctl disable gpsd.socket
Should you ever want to enable the default gpsd systemd service you can run these commands to restore it (but remember the rest of the steps in this guide won’t work!):
 sudo systemctl enable gpsd.socket
 sudo systemctl start gpsd.socket
After disabling the gpsd systemd service above you’re ready to try running gpsd manually.
Run gpsd
GPSD needs to be started up, using the following command:
sudo gpsd /dev/ttyS0 -F /var/run/gpsd.sock
Test gpsd
Now GPS doesn’t work indoors – as it needs a clear view of the sky so for this I’ve placed the PI on the window sill. Next I ssh into the pi and run cgps. There is a simple GPS client which you can run to test everything is working:
cgps -s
The -s flag is there to tell the command not to write raw data to the screen as well as the processed data.
It may take a few seconds for data to come through, but you should see a screen like this:

cgps-s
If you have any problems and cgps always displays ‘NO FIX’ under status and then aborts after a few seconds, you may need to restart the gpsd service. You can do that via the following commands:
 sudo killall gpsd
 sudo gpsd /dev/ttyS0 -F /var/run/gpsd.sock
If here still shows ‘GPS timeout’ or ‘NO FIX’,edit /etc/default/gpsd as below:
sudo nano /etc/default/gpsd
change it to look like this
# Default settings for gpsd.
# Please do not edit this file directly - use `dpkg-reconfigure gpsd' to
# change the options.
START_DAEMON="true"
GPSD_OPTIONS="-n"
DEVICES="/dev/ttyS0"
USBAUTO="false"
GPSD_SOCKET="/var/run/gpsd.sock"
Then reboot. CGPS should work then.
NOTE:If the GPS receiver is new, or has not been used for some time, it may need a few minutes or so to receive a current almanac.You need 3 GPS satellites for a 2D fix (i.e. no height) or 4 satellites for a 3D fix. Once fixed,the LED ‘3D_FIX’ will blink.
You can view http://www.catb.org/gpsd/ to get more info about gpsd.You can also try to use the following command:
* cgps
cgps and gpspipe should both just show curated data in the same way as your cat command did.

cgps
Try running gpsmon to get a live-streaming update of GPS data!
* gpsmon
The gpsmon real-time packet monitor and diagnostic tool. (This replaces the sirfmon tool in older versions.)

RTL-SDR-Sharp
https://learn.adafruit.com/getting-started-with-rtl-sdr-and-sdr-sharp